FG9 Data
From ViRBO
Focus group entry page: http://virbo.org/GEMFG9
Update - January 1, 2009, these data sets are now available through the standard ViRBO interface and have links in the data list. This page will no longer be updated, but the links will remain active.
The ViRBO web interface is still under active development, but we thought it would be useful to package up a number of data sets that may be of use for this focus group. (Other data sets that will be available through the ViRBO web interface are listed at http://virbo.org/wiki.)
Each data set is packaged into a single CDF and Matlab (V6) binary file on a uniform time grid with a version label in its file name (See versioning notes).
If you use any of these data sets,
- Watch for updates and revisions by subscribing to the FG 9 email list. Or, if you are familiar with the MediaWiki software, create an account and choose Watch this page.
- Contact the data set creator as you prepare to present or publish a work which depends on their data set.
- If you have any questions, contact rweigel@gmu.edu or the contact person associated with each data set.
Contents |
1. Qin-Denton Mag. Field Model Inputs
1.1. Summary
Data-derived magnetic field models of Earth's magnetosphere are generally developed using in-situ magnetic field measurements along with auxiliary parameters. These models predict the magnetic field at a position in the magnetosphere given values of auxiliary parameters that represent the state of the magnetosphere (i.e., disturbed or quiet). Early models required only a few parameters. For example, the Tsyganenko 1989 model required knowledge of Earth's dipole tilt and the level of geomagnetic disturbance (characterized by the Kp index). Modern magnetic field models are much more accurate but require many more auxiliary inputs. Qin et al. have developed a data set of input parameters for the Tsyganenko 2001, 2004, and 2005 magnetic field models. More information about this data set is available at Richard Denton's web page.
1.2. Data
1.2.1. Coverage
- January 1, 1963 through May 31, 2007 at 1-hour resolution.
- Overview data coverage plot: png | pdf | eps (note the spikes in the hour-of-day time series are due to the normalization by the (small) standard deviation, and the fact that a fill value was used for an hour interval with no data)
1.2.2. Access
- See README for more information about variables in this file
- All data in single CDF file QinDenton_merged_20070531-v0.cdf.zip (14 MB).
- Notes on timestamps.
- Matlab (>= 7.5) users, see notes on reading CDF files.
- Matlab < 7.5 or Octave, use QinDenton_merged_20070531-v0.mat.zip (14 MB) (V6 mat file) and use
whos -file QinDenton_merged_20070531-v0.matto see the list of variables in the file. Time variableTimeisDATENUMusing the same time stamp convention as used in the CDF file (see notes on timestamps). - ASCII file used to create above merged files: solarwind.2007.d (78 MB)
1.2.3. Updates and Revision Notes
- Last update 06/01/2007. Next update July, 2008. A 5-minute file will also be created.
1.3. Notes
- We are working with Denton to automate the update this data set as new OMNI2 data become available.
1.4. Acknowledgment
From http://www.dartmouth.edu/~rdenton/magpar/index.html
Appropriate acknowledgement would depend on the use. For minor use, you can add a sentence to the acknowledgements section such as "Magnetic field input parameters (derived from data on OMNIWeb) were provided by Richard Denton and Zhengui Qin." Please also acknowledge OMNIWeb as indicated on its website (see [1]). For a more substantial use (when the input parameters are crucial for the study) please also acknowledge a grant number that Richard Denton will give you when you contact him (see below). Then possible acknowledgement could look like "Magnetic field input parameters (derived from data on OMNIWeb) were provided by Richard Denton and Zhengui Qin, supported by so-and-so grant." If this data set is a major part of the paper (like a statistical study of the magnetic field for a large portion of the time period covered), we would appreciate an offer for us to collaborate as coauthors. Please feel free to make the decision yourself as to which form of acknowledgement is appropriate, but if possible let Richard Denton know when you publish a paper acknowledging the use of this database. You can contact Richard Denton at [2].
2. Augsburg/MACCS ULF Wave Index
2.1. Summary
- This index is described in Kozyrev et al., 2007
- More documents and presentations are available at ftp://space.augsburg.edu/ftp/MACCS/ULF_Index/_Index_readme
- From: ftp://space.augsburg.edu/ftp/MACCS/ULF_Index/_Index_readme/ULF-index_about.doc
Various geomagnetic indices (Kp, AE, Dst, SYM-H, PC) and averaged solar wind/IMF parameters quantify the energy supply in certain regions of the solar wind-magnetosphere-ionosphere system, and are used as primary tools in statistical studies of solar-terrestrial relationships. However, these indices characterize the steady-state level of the electrodynamics of the near-Earth environment. The turbulent character of solar wind drivers and the existence of natural MHD waveguides and resonators in the magnetospheric plasma in the ULF frequency range (~2-10 mHz) ensures a quasi-periodic magnetic field response to forcing at the boundary layers. Therefore, much of the turbulent nature of plasma processes of solar wind-magnetosphere-ionosphere interactions can be monitored with ground-based or space observations in the ULF frequency range. We have constructed a new index, coined a ULF wave index, characterizing the turbulent character of the energy transfer from the solar wind into the upper atmosphere and the short-scale variability of near-Earth electromagnetic processes. We suppose that a wide range of space physics studies will benefit from the introduction of this new index.
2.2. Data
2.2.1. Plots
- January 1, 1991 through December 31, 2004 at 1-hour resolution.
- Overview data coverage plot: png | pdf | eps
2.2.2. Access
- See README for more information about variables in this file
- All data in single CDF file Augsburg_ULF_merged_20041231-v0.cdf.zip (88 MB).
- Notes on timestamps.
- Matlab (>= 7.5) users, see notes on reading CDF files.
- Matlab < 7.5 or Octave, use Augsburg_ULF_merged_20041231-v0.mat.zip (180 MB) (V6 mat file) and use
whos -file Augsburg_ULF_merged_20041231-v0.matto see the list of variables in the file. Time variableTimeisDATENUMusing the same time stamp convention as used in the CDF file (see notes on timestamps). - ASCII files used to create above CDF ftp://space.augsburg.edu/ftp/MACCS/ULF_Index
2.2.3. Updates and Revision Notes
- Last update 06/23/2007.
2.3. Notes
The Australian Space Weather Agency maintains a Pc3 index. Historical plots and data are also available.
2.4. Acknowledgment
- The MACCS project. See ftp://space.augsburg.edu/ftp/MACCS/ULF_Index/_Index_readme
- Cite: Kozyrev et al., 2007
- Contact: Mark Engebretseon <engebret at augsburg.edu>
3. O'Brien-Lemon GEO Reanalysis
3.1. Summary
- This data set is described in O'Brien and Lemon, 2007
- Abstract:
Retrospective analyses of spacecraft anomalies, especially surface charging, require information about the local plasma environment. Such information is usually not available at geosynchronous orbit because most vehicles lack appropriate sensors. We have constructed a nearly continuous hourly database covering four plasma moments at geosynchronous orbit: density and temperature for hot (energies > 100 eV) protons and electrons. The four moments are provided for 24 hourly fiducial local time bins and cover the years 1990-2005. We apply an ensemble of simple models to fill in the local time gaps between plasma measurements at geosynchronous orbit made by Los Alamos sensors. Validation on artificial data gaps shows that the reconstruction has rank order correlations ranging from 0.65 to 0.97, depending on bulk moment and local time. As a demonstration, we include a comparison of our reanalysis electron temperature to on-orbit surface charging measurements at a vehicle that lacks a plasma sensor. In addition to anomaly analyses, the reanalysis database we have produced can be used to provide geosynchronous boundary conditions for numerical simulations of the inner magnetosphere and temporal variations at a single location for statistical studies.
3.2. Data
3.2.1. Coverage
- September, 1989 through September, 2005 at 1-hour resolution.
- Overview data coverage plots: ftp
3.2.2. Access
- See README file for information about variables in file.
- All data in single CDF file OBrien_reanalysis_merged_20051231-v0.cdf.zip (173 MB).
- Notes on timestamps
- Matlab users, see notes on reading CDF files
- Matlab (>= 7.5) users, see notes on reading CDF files.
- Matlab < 7.5 or Octave, use OBrienLemon_reanalysis_merged_20051231-v0.mat.zip (174 MB) (V6 mat file) and use
whos -file OBrienLemon_reanalysis_merged_20051231-v0.matto see the list of variables in the file. Time variableTimeisDATENUMusing the same time stamp convention as used in the CDF file (see notes on timestamps). - Matlab binary files used to create merged CDF file are located at http://virbo.org/ftp/obrien/reanalysis.
3.2.3. Update and Revision Notes
- Last update 06/01/2007. No update planned by data set creators.
3.3. Notes
3.4. Acknowledgment
- Cite O'Brien and Lemon, 2007
- Contact: <Paul.OBrien at aero.org>
4. Kanekal MeV Electron SAMPEX
4.1. Summary
This data set has appeared in a number of journal articles (NASA/ADS Search). The data set is shown in Figure 1 of Li et al..
4.2. Data
4.2.1. Coverage
- January 1, 1993 through December, 2001 at 1-day resolution.
4.2.2. Access
- All data in single CDF file Kanekal_SAMPEX_merged_20011231-v0.cdf.zip (1.8 MB). Note that the column labels for the single variable in this file is L = 1.1 to 10.0 in steps of 0.1.
- Notes on timestamps
- Matlab (>= 7.5) users, see notes on reading CDF files.
- Matlab < 7.5 or Octave, use Kanekal_SAMPEX_merged_20011231-v0.mat.zip (1.8 MB) (V6 mat file) and use
whos -file Kanekal_SAMPEX_merged_20011231-v0.matto see the list of variables in the file. Time variableTimeisDATENUMusing the same time stamp convention as used in the CDF file (see notes on timestamps). - ASCII files used to create merged CDF file http://virbo.org/ftp/users/kanekal/SAMPEX.
4.2.3. Update and Revision Notes
- Last update 06/01/2005. We are looking for the data files for 2002 and 2003.
4.3. Notes
4.4. Acknowledgment
- Please acknowledge the SAMPEX staff, in particular Shri Kanekal (you should also consider having him as a co-author on any resulting published work).
- Contact: <shrikanth.kanekal at lasp.colorado.edu>
5. AMIE-derived Geomagnetic Indices
5.1. Summary
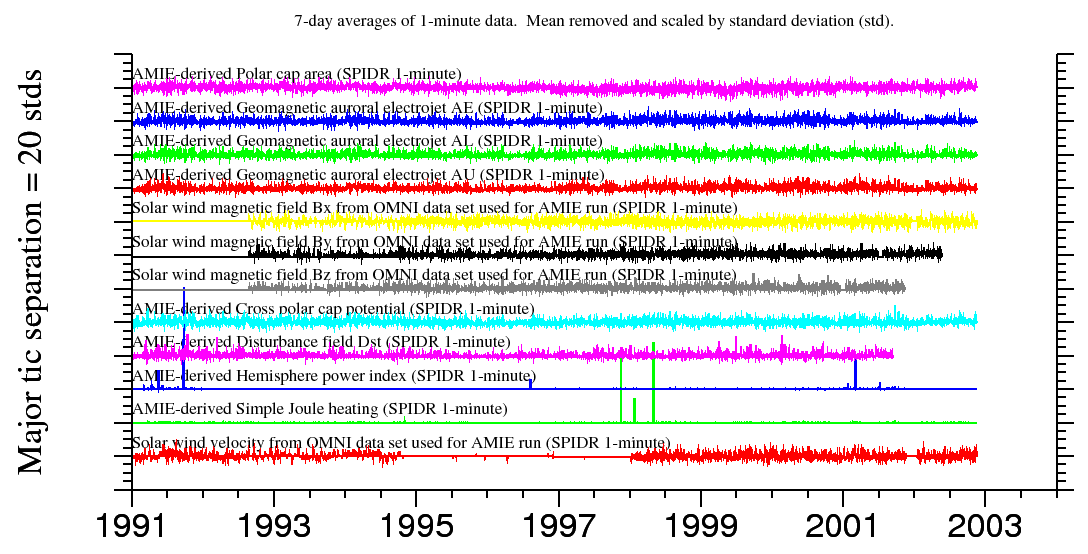
The AMIE procedure is an optimally constrained, weighted least-squares fit of electric potential distribution to diverse types of atmospheric observations. Knowledge of these distributions is important in many areas of magnetospheric, ionospheric, and thermospheric physics. In the Space Weather Reanalysis project, Kihn and Ridley prepared inputs for and ran the AMIE model over the time span of January 1, 1991 through December 31, 2002. Some of the derived products of this simulation are polar cap area, geomagnetic indices AE, AU, and AL, Dst, hemisphere power, Joule heating, and cross polar cap potential.
This data set has been discuss in a number of presentations and journal articles. See (NASA/ADS Search) for more information.
5.2. Data
5.2.1. Coverage
- January 1, 1991 through December, 2002 at 1-minute resolution.
- Overview data coverage plot: png | pdf | eps
5.2.2. Access
- All data in single CDF file SPIDR_AMIE_merged_20021231-v0.cdf.zip (218 MB).
- Note that the time stamps in the original data files (and the merged files) are at the start of a minute. The averaging interval of the data is +/- approximately 30 seconds from the time stamp. This convention is consistent with the convention typically used in data files for ground magnetometers (see notes on timestamps).
- Matlab (>= 7.5) users, see notes on reading CDF files.
- Matlab < 7.5 or Octave, use SPIDR_AMIE_merged_20021231-v0.mat.zip (117 MB) (V6 mat file) and use
whos -file SPIDR_AMIE_merged_20021231-v0.matto see the list of variables in the file. Time variableTimeisDATENUMusing the same time stamp convention as used in the CDF file (see notes on timestamps). - Original data available via SPIDR interface at http://spidr.ngdc.noaa.gov.
5.2.3. Update and Revision Notes
- Data for solar wind Bx, By, and Bz variables use a zero to indicate no propagated IMF value for the minute.
5.3. Notes
- We are looking for more information on how the solar wind input variables were derived and general documentation about this data set.
5.4. Acknowledgment
- Cite one of the papers listed in the Summary.
- Contact: <Eric.A.Kihn at noaa.gov>
