autoplot
From ViRBO
ViRBO has developed a suite of bookmarks for the Autoplot visualization application.
To import these bookmarks into Autoplot, click this link, which initiates a ~10-second installation process that works on most operating systems and browsers.
|
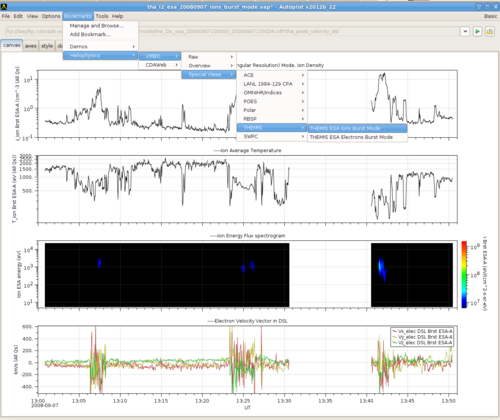
Types of bookmarks: 1. Raw - Selecting a raw bookmark will result in an automatic single-panel display of data from a given data provider. (Some GUI interaction may be required for some bookmarks.) Click the right or left arrows to view the day after or day before the day in view. 2. Special Views - Stylized plots using data from many data providers. For examples, see the ViRBO sub-folder. Examples of Data Views include stack plots of measurements from Polar, Cluster, ACE, THEMIS, and NPOES. Data Views are generally created by scientists using the Expert GUI mode and Raw Bookmarks and then contributed to ViRBO's Special Views repository. A tutorial for creating special views will be presented at the Summer 2012 GEM workshop. 3. Overviews - A data set for which the initial view is of the full time range of available data. Draw a box on a time range to zoom in on a specific time interval.
|

